Monthly Information Bulletin on Corporate Sector May 2020

Monthly Information Bulletin on Corporate Sector May 2020 HIGHLIGHTS

I. REGISTERED COMPANIES AS ON 31th May, 2020

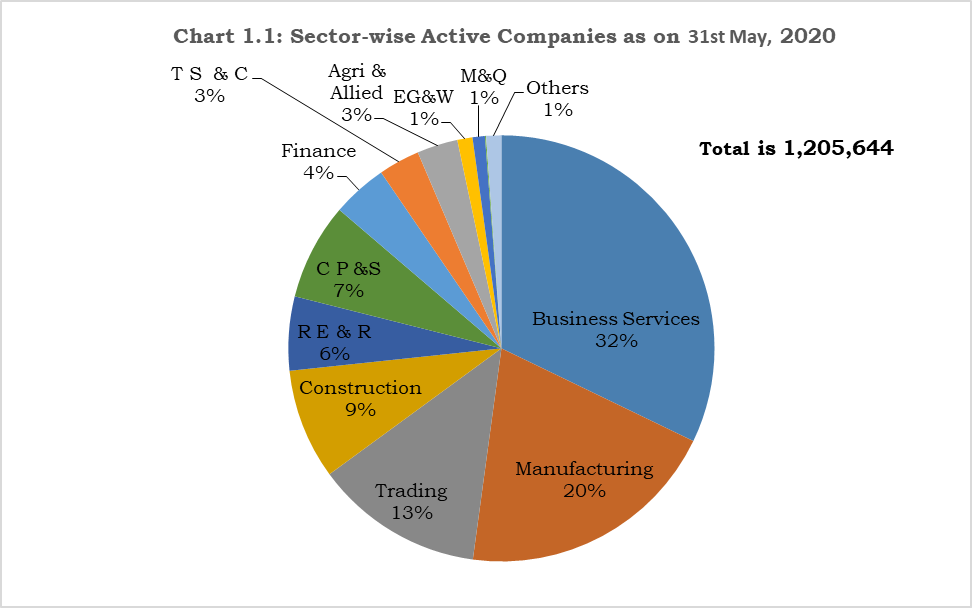
The total number of companies registered in the country as on 31st May, 2020 stood at 2,004,040. Of them 745,979 companies were closed. 2,245 companies were assigned dormant status as per the Companies Act, 2013; 6,668 were under liquidation; 43,504 companies were in the process of being struck-off. Active in progress status is now invalid and companies under this category, lies under Active Status. Taking the above into account, there were 1,205,644 active companies as on 31st May, 2020.

1. Out of the 745,979 closed companies, 10,977 companies were liquidated/dissolved; 690,667 companies were declared defunct (and hence struck-off after issuance of notice u/s 248). 25,628 companies were amalgamated/ merged with other companies; 13,833 companies were converted to Limited Liability Partnership (LLP) and 4,874 were converted to LLP and dissolved. Table-1.1 presents the summary picture of companies count as on 31st May, 2020.

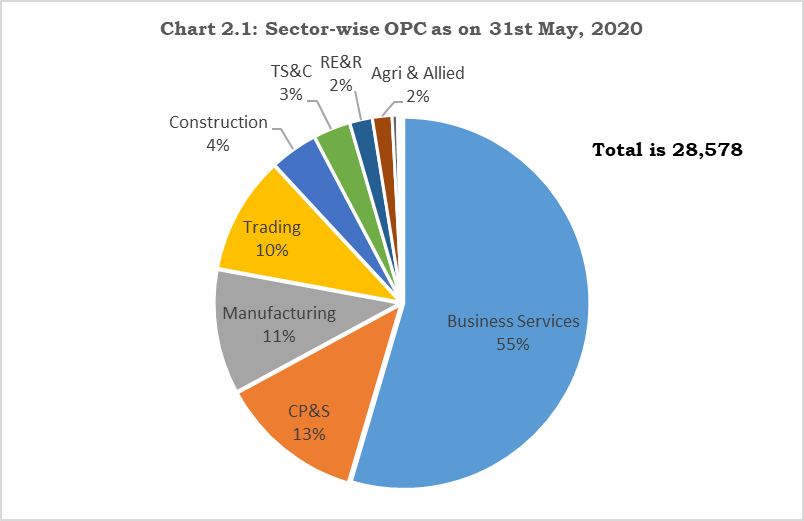
2. Out of the 1,205,644 active companies, 1,197,854 were limited by shares; 7,484 were limited by guarantee and 306 were unlimited companies. Out of the companies limited by shares, 63,698 were public, 1,105,578 were private including 28,578 one person companies. Among the public limited companies, 6,801 were listed (Table 1.2).

3. State/UT-wise distribution of registered companies indicates that Maharashtra has the highest number of companies (395,069), followed by Delhi (348,259) and West Bengal (207,200). Amongst ‘Active Companies’, Maharashtra has the maximum number of active companies (235,942), followed by Delhi (204,116) and West Bengal (126,161) as on 31st May, 2020. (Table-1.3).

4. Economic-activity wise classification of active companies reveals that highest number of companies were in Business Services (387,766) followed by Manufacturing (240,855), Trading (154,349) and Construction (101,007). Business Services comprise of Information Technology, Research & Development and other business activities such as law, audit & accounts and consultancy, etc. (Table-1.4 and Chart 1.1).


Monthly Information Bulletin on Corporate Sector May 2020

‘M&Q’ is Mining & Quarrying, ‘TS&C’ is Transport, Storage and Communication, and ‘CP&S is Community, Personal & Social Services, ‘RE&R’ is Real Estate and Renting, ’EG&W’, is Electricity Gas & Water. 13,889 active companies (Others) are having invalid Economic Activity (NIC-2004) Code.

II. ONE PERSON COMPANY

5. Up to 31st May, 2020, a total number of 28,578 One Person Companies (OPCs) were registered with collective authorized capital of Rs. 854.5 crores. Economic activity wise classification of OPCs up to 31st May reveals that the highest number of OPCs were in Business Services (15,594) followed by Community, Personal & Social Services (3,584), Manufacturing (3,087) and Trading (2,918) (Chart 2.1). During the month of May, 2020, a total of 355 OPC were registered with authorized capital of Rs. 10.92 crores. Economic activity wise classification of OPC during the month reveals that highest number of 143 OPCs were registered in Business Services, followed by 57 in Community, personal & Social Services, 54 in Manufacturing, and 54 in Trading. (Table 2.1).

Monthly Information Bulletin on Corporate Sector May 2020

III. TREND OF REGISTRATION OF NEW COMPANIES

6. An analysis of registration of new companies during May 2018 to May 2020 indicates that monthly registration of companies has increased after hitting lowest of 3,209 Companies in April, 2020 (Chart 3.1). A total of 4,835 companies were registered in May, 2020 as compared to 11,281 in May 2019. An increase (50.67%) in registration of companies has been witnessed in May 2020 over the previous month which may be due to easing down of lockdown restrictions in wake of COVID-19 outbreak (Table 3.1).

Monthly Information Bulletin on Corporate Sector May 2020

IV. REGISTRATION OF NEW COMPANIES DURING MAY, 2020

7. During the month of May 2020, a total of 4,835 companies were registered with collective authorized capital of Rs. 780.77 crores. Of them 4,806 companies were registered as Companies Limited by Shares with authorized capital of Rs. 780.76 crores; (Table-4.1).

8. Economic-activity wise classification of companies registered during May 2020 (Table-4.2 and Chart 4.1) reveals that the predominant share of companies is in Business Services (1,663) followed by Manufacturing (904), Community, personal & Social Services (705), Trading (632) and Construction (229).

Monthly Information Bulletin on Corporate Sector May 2020

‘EG&W’ is Electricity, Gas and Water, ‘TS&C’ is Transport, Storage and Communication, ‘CP&S’ is Community, personal & Social Services, ’RE&R’ is Real Estate and Renting.

9. During May, 2020, 770 (15.93%) companies were registered in Maharashtra, followed by 652 (13.49%) in Delhi, and 486 (10.05%) in Karnataka (Table-4.3).

Table 1.1 Summary Statement on Companies in India as on 31th May, 2020


Companies Registered as on 31th May, 2020

20,04,040

1

Number of Closed Companies

7,45,979

i

No. of Companies Liquidated/Dissolved

10,977

ii

No. of Companies Defunct/ Struck-off (Section 248 of CA, 2013)


6,90,667

iii

No. of Companies Amalgamated/merged

25,628

iv

No. of Companies Converted to LLP

13,833

v

No. of Companies Converted to LLP and dissolved

4,874

2

Number of Companies lying dormant u/s 455 of Companies Act, 2013


2,245

3

Number of Companies under Liquidation

6,668


4

Number of Companies which are under the process of Section 248 of the Companies Act, 2013


43,504

6

Number of Active companies

12,05,644

Of which


Companies Limited by Shares

11,97,854

Companies Limited by Guarantees

7,484

Unlimited Companies

306

Table 1.2 : Active Companies Limited by Shares as on 31th May, 2020


Sl.

No.


Companies Limited by Shares


Government


Non- Government


Total

1

Public Limited


1,468


62,230


63,698


Of which-


i

Listed


78


6,723


6,801

ii

Unlisted


1,390


55,507


56,897

2

Private Limited


600


11,04,978


11,05,578


Of which


One Person Company

-


28,578


28,578


Total


2,068


11,95,786


11,97,854

Table 1.3: State/UT-wise Status of Companies Registered as on 31th May, 2020


Sl.

No.


State


Registered


Closed

Dormant u/s 455 of CA,

2013


Under Liquidation


Under Struck-

off


Active

1

Andaman & Nicobar

480

121

1

-

4

354

2

Andhra Pradesh

33,452

10,855

27

52

1,888

20,630

3

Arunachal Pradesh

622

302

-

2

59

259

4

Assam

12,119

3,725

1

15

1,162

7,216

5

Bihar

36,719

8,887

27

41

3,544

24,220

6

Chandigarh

15,035

7,571

11

64

286

7,103

7

Chattisgarh

10,853

3,083

20

6

51

7,693


8

Dadra & Nagar Haveli

553

141

-

-


8

404

9

Daman and Diu

397

105

-

3

37

252

10

Delhi

3,48,259

1,37,068

332

865

5,878

2,04,116

11

Goa

9,006

3,906

15

13

664

4,408

12

Gujarat

1,06,502

37,650

60

544

2,930

65,318

13

Haryana

51,828

13,796

87

70

1,012

36,863

14

Himachal Pradesh

6,661

2,740

8

20

262

3,631

15

Jammu & Kashmir

6,032

2,543

2

18

141

3,328

16

Jharkhand

15,360

3,550

6

12

920

10,872

17

Karnataka

1,27,311

45,226

135

580

1,970

79,400

18

Kerala

56,561

20,887

176

291

897

34,309

19

Lakshadweep

21

7

-

-

-

14

20

Leh and Ladakh

49

18

-

-

-

31

21

Madhya Pradesh

41,725

16,411

31

93

255

24,935

22

Maharashtra

3,95,069

1,50,635

346

1,946

6,200

2,35,942

23

Manipur

1,061

215

1

-

41

804

24

Meghalaya

1,064

433

1

1

68

561

25

Mizoram

181

67

-

-

7

107

26

Nagaland

607

323

1

1

34

248

27

Orissa

27,378

10,232

161

47

199

16,738

28

Pondicherry

3,319

1,906

2

6

34

1,371

29

Punjab

32,707

14,901

18

134

562

17,092

30

Rajasthan

62,066

23,627

28

90

196

38,125

31

Sikkim

2

-

-

-

-

2

32

Tamil Nadu

1,51,604

67,392

169

416

3,882

79,745

33

Telangana

1,13,931

44,893

57

266

2,656

66,059

34

Tripura

665

150

-

-

37

478

35

Uttar Pradesh

1,18,497

34,668

81

213

3,033

80,502

36

Uttarakhand

9,144

2,196

6

15

574

6,353

37

West Bengal

2,07,200

75,749

433

844

4,013

1,26,161

Total

20,04,040

7,45,979

2,243

6,668

43,504

12,05,644

Table 1.4: Economic Activity-wise Active Companies as on 31th May, 2020                                         (Authorized Capital in Rs. Crore)

Sl.

No.


Economic Activity

Private

Public

Total

Number

Authorized Capital

Number

Authorized Capital

Number

Authorized Capital

I

Agriculture and Allied Activities

35,088

25,433.52

2,239

34,327.20

37,327

59,760.72

II

Industry

3,42,826

11,42,757.76

24,195

28,78,973.83

3,67,021

40,21,731.59

1

Manufacturing

2,23,180

6,91,398.44

17,675

11,05,676.13

2,40,855

17,97,074.56

i

Metals & Chemicals, and products thereof

76,193

2,85,145.64

7,663

4,68,726.28

83,856

7,53,871.92

ii

Machinery & Equipments

52,695

2,61,233.84

3,341

5,07,139.44

56,036

7,68,373.28

iii

Textiles

29,780

40,271.19

2,612

55,730.58

32,392

96,001.77

iv

Food stuffs

32,229

62,536.72

2,381

42,721.89

34,610

1,05,258.60


v

Paper & Paper products, Publishing, printing and reproduction of recorded

media


14,590


15,746.52


831


16,299.74


15,421


32,046.25

vi

Others

12,305

19,208.44

487

11,596.67

12,792

30,805.10

vii

Leather & products thereof

2,879

3,680.23

186

2,048.76

3,065

5,728.99

viii

Wood Products

2,509

3,575.87

174

1,412.78

2,683

4,988.65

2

Construction

96,836

2,00,125.14

4,171

3,88,971.57

1,01,007

5,89,096.72

3

Electricity, Gas & Water companies

12,208

2,09,298.27

1,641

13,04,591.04

13,849

15,13,889.30

4

Mining & Quarrying

10,602

41,935.92

708

79,735.09

11,310

1,21,671.01

III

Services

7,50,196

13,68,897.34

37,236

21,82,425.79

7,87,432

35,51,323.13

1

Business Services

3,77,951

5,10,551.04

9,815

10,42,130.09

3,87,766

15,52,681.13

2

Trading

1,48,645

2,75,386.82

5,704

1,08,992.61

1,54,349

3,84,379.43

3

Real Estate and Renting

65,007

1,05,718.76

2,608

56,538.44

67,615

1,62,257.19

4

Community, personal & Social Services

84,460

1,02,896.47

3,935

1,50,442.18

88,395

2,53,338.65

5

Finance

37,000

2,05,354.15

13,563

4,75,266.06

50,563

6,80,620.21

6

Transport, storage and Communications

36,253

1,67,515.52

1,471

2,92,021.26

37,724

4,59,536.78

7

Insurance

880

1,474.58

140

57,035.16

1,020

58,509.74

IV

Others

11,556

48,154.40

2,308

1,40,819.88

13,864

1,88,974.28

Total

11,39,666

25,85,243.02

65,978

52,36,546.70

12,05,644

78,21,789.72

Table 2.1: Economic Activity-wise One Person Company                                                             (Authorized Capital in Rs. Lakh)


Sl. No.


Economic Activity

Up to 31.05.2020

During May, 2020

Number

Authorized Capital

Number

Authorized                   Capital

I

Agriculture and Allied Activities

484

1,768.26

10

54.50

II

Industry

4,452

16,094.80

69

233.30

1

Manufacturing

3,087

10,553.89

54

179.20

2

Construction

1,188

4,972.96

13

52.10

3

Electricity, Gas & Water companies

131

436.65

2

2.00

4

Mining & Quarrying

46

131.30

-

-

III

Services

23,639

67,549.72

276

805.00

1

Business Services

15,594

41,353.40

143

379.05

2

Community, personal & Social Services

3,584

10,374.31

57

181.95

3

Trading

2,918

10,028.28

54

176.40

4

Real Estate and Renting

560

2,614.69

6

9.50

5

Transport, storage and Communications

921

2,611.05

13

55.10

6

Finance

60

548.00

3

3.00

7

Insurance

2

20.00

-

-

IV

Others

3

35.00

-

-

Total

28,578

85,447.79

355

1,092.80