Monthly Information Bulletin on Corporate Sector April 2020

Monthly Information Bulletin on Corporate Sector April 2020

REGISTERED COMPANIES AS ON 30th April, 2020

The total number of companies registered in the country as on 30th April, 2020 stood at 1,999,190. Of them 745,723 companies were closed. 2,213 companies were assigned dormant status as per the Companies Act, 2013; 6,652 were under liquidation; 43,325 companies were in the process of being struck-off. Active in progress status is now invalid and companies under this category, comes under active status. Taking the above into account, there were 1,201,277 active companies as on 30th April, 2020.

1. Out of the 745,723 closed companies, 10,974 companies were liquidated/dissolved; 690,533 companies were declared defunct (and hence struck-off after issuance of notice u/s 248). 25,575 companies were amalgamated/ merged with other companies; 13,767 companies were converted to Limited Liability Partnership (LLP) and 4,874 were converted to LLP and dissolved. Table-1.1 presents the summary picture of companies count as on 30th April, 2020.

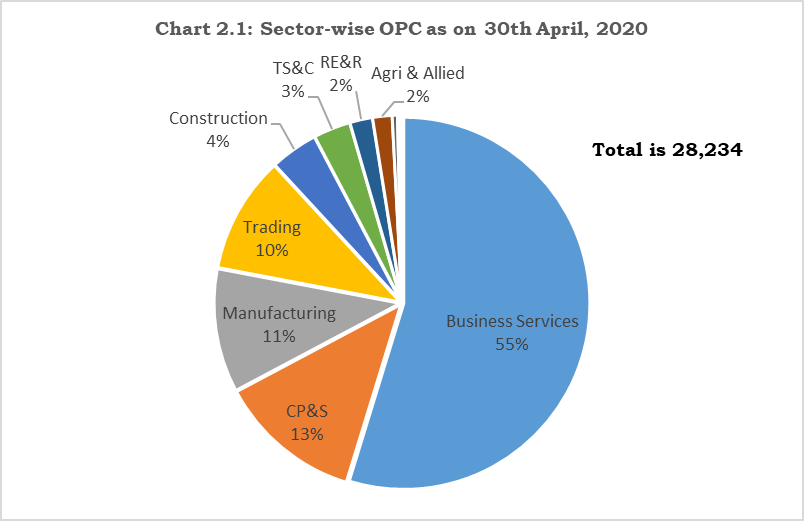
2. Out of the 1,201,277 active companies, 1,193,515 were limited by shares; 7,456 were limited by guarantee and 306 were unlimited companies. Out of the companies limited by shares, 63,616 were public, 1,101,668 were private including 28,234 one person companies. Among the public limited companies, 6,802 were listed (Table 1.2).

3. State/UT-wise distribution of registered companies indicates that Maharashtra has the highest number of companies (394,298), followed by Delhi (347,605) and West Bengal (207,057). Amongst ‘Active Companies’, Maharashtra has the maximum number of active companies (235,213), followed by Delhi (203,494) and West Bengal (126,053) as on 30th April, 2020. (Table-1.3).

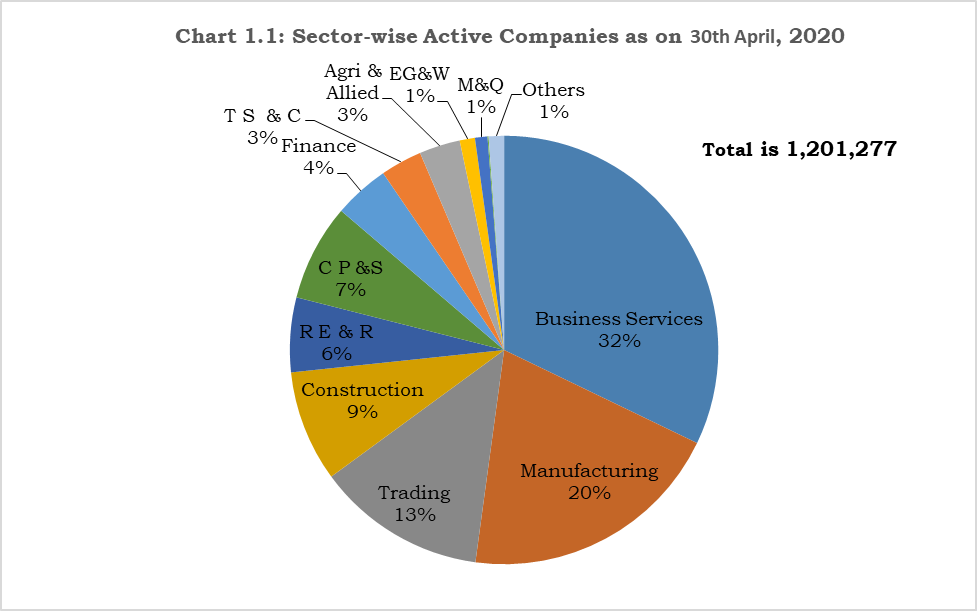
4. Economic-activity wise classification of active companies reveals that highest number of companies were in Business Services (386,270) followed by Manufacturing (240,050), Trading (153,758) and Construction (100,809). Business Services comprise of Information Technology, Research & Development and other business activities such as law, audit & accounts and consultancy, etc. (Table-1.4 and Chart 1.1).


Monthly Information Bulletin on Corporate Sector April 2020

‘M&Q’ is Mining & Quarrying, ‘TS&C’ is Transport, Storage and Communication, and ‘CP&S is Community, Personal & Social Services, ‘RE&R’ is Real Estate and Renting, ’EG&W’, is Electricity Gas & Water. 13,889 active companies (Others) are having invalid Economic Activity (NIC-2004) Code.


II. ONE PERSON COMPANY

5. Up to 30th April, 2020, a total number of 28,234 One Person Companies (OPCs) were registered with collective authorized capital of Rs. 843 crores. Economic activity wise classification of OPCs up to 30th April reveals that the highest number of OPCs were in Business Services (15,456) followed by Community, Personal & Social Services (3,528), Manufacturing (3,034) and Trading (2,867) (Chart 2.1). During the month of April, 2020, a total of 227 OPC were registered with authorized capital of Rs. 7.95 crores. Economic activity wise classification of OPC during the month reveals that highest number of 100 OPCs were registered in Business Services, followed by 39 in Manufacturing, 33 in Community, personal & Social Services and 29 in Trading. (Table 2.1).

III. TREND OF REGISTRATION OF NEW COMPANIES

6. An analysis of registration of new companies during April 2018 to April 2020 indicates that monthly registration of companies is lowest in April 2020 (Chart 3.1). A total of 3,209 companies were registered in April, 2020 as compared to 10,383 in April 2019. A decrease (44.55%) in registration of companies has been witnessed in April 2020 over the previous month which was mainly due to pandemic COVID-19 and lockdown measures taken by government (Table 3.1).

Monthly Information Bulletin on Corporate Sector April 2020

IV. REGISTRATION OF NEW COMPANIES DURING APRIL, 2020

7. During the month of April 2020, a total of 3,209 companies were registered with collective authorized capital of Rs. 1,429.75 crores. Of them 3,199 companies were registered as Companies Limited by Shares with authorized capital of Rs. 1,429.74 crores; (Table-4.1).

8. Economic-activity wise classification of companies registered during April 2020 (Table-4.2 and Chart 4.1) reveals that the predominant share of companies is in Business Services (1,089) followed by Manufacturing (583), Community, personal & Social Services (489), Trading (388) and Construction (160).

Monthly Information Bulletin on Corporate Sector April 2020

‘EG&W’ is Electricity, Gas and Water, ‘TS&C’ is Transport, Storage and Communication, ‘CP&S’ is Community, personal & Social Services, ’RE&R’ is Real Estate and Renting.

9. During April, 2020, 591 (18.42%) companies were registered in Maharashtra, followed by 368 (11.47%) in Delhi, and 350 (10.91%) in Karnataka (Table-4.3).

Monthly Information Bulletin on Corporate Sector April 2020

Table 1.1 Summary Statement on Companies in India as on 30th April, 2020


Companies Registered as on 30th April, 2020

19,99,190

1

Number of Closed Companies

7,45,723

i

No. of Companies Liquidated/Dissolved

10,974


ii


No. of Companies Defunct/ Struck-off (Section 248 of CA, 2013)


6,90,533

iii

No. of Companies Amalgamated/merged

25,575

iv

No. of Companies Converted to LLP

13,767

v

No. of Companies Converted to LLP and dissolved

4,874


2


Number of Companies lying dormant u/s 455 of Companies Act, 2013


2,213

3

Number of Companies under Liquidation

6,652


4


Number of Companies which are under the process of Section 248 of the Companies Act, 2013


43,325

6

Number of Active companies

12,01,277

Of which


Companies Limited by Shares

11,93,515

Companies Limited by Guarantees

7,456

Unlimited Companies

306

Table 1.2 : Active Companies Limited by Shares as on 30th April, 2020


Sl.

No.


Companies Limited by Shares


Government

Non- Government


Total


1

Public Limited


1,461


62,152


63,613


Of which-


i

Listed


78


6,724


6,802


ii

Unlisted


1,383


55,428


56,811


2

Private Limited


599


11,01,069


11,01,668


Of which


One Person Company

-


28,234


28,234


Total


2,060


11,91,455


11,93,515

Table 1.3: State/UT-wise Status of Companies Registered as on 30th April, 2020


Sl.

No.


State


Registered


Closed

Dormant u/s 455 of

CA, 2013


Under Liquidation

Under Struck-

off


Active

1

Andaman & Nicobar

480

121

1

-

4

354

2

Andhra Pradesh

33,331

10,857

27

52

1,881

20,514

3

Arunachal Pradesh

621

302

-

2

59

258

4

Assam

12,080

3,721

1

15

1,159

7,184

5

Bihar

36,532

8,831

27

41

3,600

24,033

6

Chandigarh

15,014

7,571

11

64

284

7,084

7

Chattisgarh

10,823

3,081

20

6

50

7,666


8


Dadra & Nagar Haveli


553


141


-


-


8


404

9

Daman and Diu

397

105

-

3

37

252

10

Delhi

3,47,605

1,37,047

332

865

5,867

2,03,494

11

Goa

8,990

3,907

15

13

664

4,391

12

Gujarat

1,06,295

37,645

60

544

2,929

65,117

13

Haryana

51,532

13,794

87

70

1,008

36,573

14

Himachal Pradesh

6,641

2,740

8

20

262

3,611

15

Jammu & Kashmir

6,013

2,543

2

18

141

3,309

16

Jharkhand

15,299

3,550

6

12

922

10,809

17

Karnataka

1,26,827

45,226

134

580

1,922

78,965

18

Kerala

56,381

20,865

175

292

819

34,229

19

Lakshadweep

21

6

-

-

1

14

20

Leh and Ladakh

48

18

-

-

-

30

21

Madhya Pradesh

41,644

16,411

31

93

247

24,862

22

Maharashtra

3,94,298

1,50,545

315

1,946

6,279

2,35,213

23

Manipur

1,053

215

1

-

41

796

24

Meghalaya

1,062

433

1

1

68

559

25

Mizoram

181

67

-

-

7

107

26

Nagaland

606

323

1

1

34

247

27

Orissa

27,289

10,233

161

48

199

16,647

28

Pondicherry

3,314

1,906

2

6

34

1,366

29

Punjab

32,641

14,899

18

134

556

17,034

30

Rajasthan

61,900

23,580

28

91

231

37,970

31

Sikkim

2

-

-

-

-

2

32

Tamil Nadu

1,51,253

67,392

169

415

3,858

79,419

33

Telangana

1,13,624

44,890

57

268

2,542

65,867

34

Tripura

660

150

-

-

37

473

35

Uttar Pradesh

1,18,020

34,663

82

214

3,003

80,058

36

Uttarakhand

9,103

2,195

6

15

574

6,313

37

West Bengal

2,07,057

75,750

433

823

3,998

1,26,053

Total

19,99,190

7,45,723

2,211

6,652

43,325

12,01,277

Table 1.4: Economic Activity-wise Active Companies as on 30th April, 2020                                                                                  (Authorized Capital in Rs. Crore)

Sl.

No.


Economic Activity

Private

Public

Total

Number

Authorized

Capital

Number

Authorized

Capital

Number

Authorized

Capital

I


Agriculture and Allied Activities


34,856


25,370.57


2,240


34,319.50


37,096


59,690.07

II

Industry

3,41,765

11,37,964.36

24,198

28,65,716.39

3,65,963

40,03,680.76

1

Manufacturing

2,22,363

6,89,505.33

17,687

11,00,129.47

2,40,050

17,89,634.80

i


Metals & Chemicals, and products thereof


75,979


2,84,756.10


7,675


4,63,315.27


83,654


7,48,071.37

ii


Machinery & Equipments


52,491


2,60,141.94


3,338


5,06,994.10


55,829


7,67,136.04

iii


Textiles


29,705


40,280.82


2,616


55,736.43


32,321


96,017.24

iv


Food stuffs


32,053


62,372.09


2,384


42,736.54


34,437


1,05,108.63

v

Paper & Paper products, Publishing, printing

and reproduction of recorded media


14,524


15,703.59


827


16,298.58


15,351


32,002.16

vi


Others


12,231


18,996.24


487


11,598.62


12,718


30,594.85

vii


Leather & products thereof


2,873


3,670.00


186


2,048.76


3,059


5,718.76

viii


Wood Products


2,507


3,584.56


174


1,401.18


2,681


4,985.74

2


Construction


96,643


1,99,934.16


4,166


3,88,967.62


1,00,809


5,88,901.78

3


Electricity, Gas & Water companies


12,177


2,06,597.47


1,636


12,97,884.04


13,813


15,04,481.50

4


Mining & Quarrying


10,582


41,927.41


709


78,735.27


11,291


1,20,662.68

III

Services

7,47,200

13,68,419.66

37,148

21,81,484.03

7,84,348

35,49,903.68

1

Business Services

3,76,459

5,10,454.66

9,811

10,41,647.07

3,86,270

15,52,101.73

2

Trading

1,48,053

2,76,116.74

5,705

1,08,670.16

1,53,758

3,84,786.90

3


Real Estate and Renting


64,935


1,05,596.52


2,611


56,539.23


67,546


1,62,135.75

4


Community, personal & Social Services


83,780


1,02,585.47


3,928


1,50,365.04


87,708


2,52,950.51

5


Finance


36,931


2,04,784.36


13,495


4,76,068.37


50,426


6,80,852.74

6


Transport, storage and Communications


36,163


1,67,441.86


1,458


2,91,158.99


37,621


4,58,600.85

7


Insurance


879


1,440.03


140


57,035.16


1,019


58,475.19

IV


Others


11,563


48,211.62


2,307


1,40,888.78


13,870


1,89,100.40

Total

11,35,384

25,79,966.21

65,893

52,22,408.69

12,01,277

78,02,374.91

Table 2.1: Economic Activity-wise One Person Company                                                                                                                                                                   (Authorized Capital in Rs. Lakh)


Sl. No.


Economic Activity

Up to 30.04.2020

During April, 2020

Number

Authorized Capital

Number

Authorized                   Capital

I

Agriculture and Allied Activities

475

1,714.76

5

13.50

II

Industry

4,383

15,848.25

50

240.20

1

Manufacturing

3,034

10,371.44

39

189.05

2

Construction

1,174

4,910.86

10

50.15

3

Electricity, Gas & Water companies

129

434.65

1

1.00

4

Mining & Quarrying

46

131.30

-

-

III

Services

23,373

66,685.72

172

541.90

1

Business Services

15,456

40,950.35

100

289.40

2

Community, personal & Social Services

3,528

10,202.36

33

121.10

3

Trading

2,867

9,814.88

29

91.20

4

Real Estate and Renting

554

2,596.19

4

21.20

5

Transport, storage and Communications

909

2,556.95

6

19.00

6

Finance

57

545.00

-

-

7

Insurance

2

20.00

-

-

IV

Others

3

35.00

-

-

Total

28,234

84,283.74

227

795.60

Table 3.1: Number of Companies Registered during the months


Month


Public Companies


Private Companies


Total Companies

April, 2018

187

10,364

10,551

May, 2018

250

10,517

10,767

June, 2018

204

8,838

9,042

July, 2018

152

7,593

7,745

August, 2018

149

7,591

7,740

September, 2018

276

13,120

13,396

October, 2018

286

11,339

11,625

November, 2018

191

8,554

8,745

December, 2018

211

9,273

9,484

January, 2019

304

12,160

12,464

April, 2019

331

11,445

11,776

March, 2019

270

10,300

10,570

April, 2019

275

10,108

10,383

May, 2019

274

11,007

11,281

June, 2019

282

9,337

9,619

July, 2019

316

10,383

10,699

August, 2019

175

9,829

10,004

September, 2019

272

8,899

9,171

October, 2019

308

9,625

9,933

November, 2019

292

10,315

10,607

December, 2019

290

11,767

12,057

January, 2020

365

12,384

12,749

April, 2020

290

10,139

10,429

March, 2020

110

5,678

5,788

April, 2020

96

3,113

3,209